
Thomas Demark received two higher degrees, legal and economics, and dedicated 40 years of his life to improving market analysis systems. His career began in the early 1970s with a pension and private equity firm and he began to gain momentum rapidly.
Demark was able to save the National Investment Service from financial collapse in 1974 through clever diversification and virtuous deals with stocks and commodities, and later led a consulting division formed specifically for him.
In 1982 he left NIS and founded his own company, DeMark Investment Advisory. His clients included Bill Gates, George Soros, Goldman Sachs and other investment giants.
In 1988, Thomas was promoted to Vice President by Paul Tudor Jones. During this time, he continued to lead the market research and development of analytical systems. The materials were included in his first book, published in 1994.
Since 1995, Demark has been actively involved in educational activities, publishing new publications, developing new indicators, and managing its own funds. In 2011, the trader was recognized as the best analyst of the year.
The subtleties of working with charts when drawing trend lines
Technical analysis as a tool for making trading decisions is designed to be accurate. However, within this discipline there is a basic contradiction that has not yet been completely overcome. We are talking about a subjective view when creating a graphical model of price movement.
Trend lines are a geometric representation of the mean values of an indicator over a given time interval. A trader may draw many such lines, and his chart will most likely differ from his colleague’s rendering, even if they work on the same time frame: the point is to choose the critical points.
Thomas Demark was one of the first to find an effective solution. On the example of daily charts reflecting the price dynamics of various financial instruments, he developed a method of detecting two extreme points (TD points), through which a real trend line (TD line) will pass.
The author described the following criteria:
- A point is considered critical or fundamental if it has a minimum/maximum, below/above which the price did not rise/fall three times: the previous, the current and the next day.
- A significant price floor must be below Close, set two days before the pivot point.
- The true maximum must be above Close two days before its detection.
- The Closing price in the next session after setting the reference minimum/maximum must not be lower/higher than the value established by the rate of fall/growth of the TD line.
The last three points take into account the influence of the gaps and are important to verify the validity of the pivot points.
Demark recommends that the lines themselves be drawn from right to left, arguing for the choice of the present-to-future perspective on the fact that the current state of the market is far more important than past price movements.
Choosing reference points when breaking a trend line
The correct calculation of price targets allows the trader to make a good profit in the event of a breakout of the TD line. The author suggests looking for signals to enter trades in three different ways.
1. Before the breakdown, determine the distance from a specific price value to the trend line. For a downtrend, the minimum value below the TD line is taken. For an uptrend, the maximum price above this line.
2. Mark the distance between the intraday low or high found on the trading day with the Close low or high and the trend line.
3. Set the distance from the close on a day with an intraday low or high to the trend line.
To get a buy target, you need to add a mathematically verified value to the price marked at the breakout point of the downtrend line.
To get a sell signal, you need to subtract the value received from the price at the breakout point of the rising trend line.
The first price projector is considered the simplest, and the third offers the most accurate predictions. However, we note that none of the benchmarks can give a 100% guarantee of making a profit when entering a trade.
Breakdown of truth criteria
Demark describes three qualifiers that distinguish a true breakout from a false breakout.
1. At the closing price (Close) one day before the failure.
If the close has declined the day before the breakout, the trader receives a buy signal. If there was a rally at the close on the eve of the downside breakout, it is a signal to sell.
2. At the opening price (Open) on the day of the breakdown.
A breakdown due to gaps is also considered reliable. If the open is above the breakout price, this is a sure incentive to buy. If below – for sale.
3. By the difference between the minimum price (Low) or maximum (High) and the closing price (Close) of the day before the breakout of the TD line.
By applying qualifier 3, the calculations are more complicated.
If there is a breakdown, you must find the difference between the high and the close recorded the previous day and then subtract the resulting value from the close. If the result is higher than the breakout price, you can open a sell trade.
When breaking, they look for the difference between the Close and the Low recorded during the day. This value is added to the closing price. If the total amount is less than the breakout price, a buy trade is opened.
One nuance should be noted in these calculations: the formula uses the low or high price set the day before the breakout. However, if this indicator turns out to be higher (in the case of a downtrend) or lower (in the case of an uptrend) than the closing price 2 days before the breakout, this closing price is taken to calculate the difference.
The rules described by Demark work well on daily charts. On shorter timeframes, you can use a simplified scheme and enter the market after a retest of a broken trend line.
How to work with corrective movement
To predict a correction on a price chart, Demark suggests the following sequence of actions:
find a recent extreme and draw a horizontal line from right to left until a lower low or higher high is observed, respectively.
Find the critical price in the section between the points obtained. It will correspond to the maximum between two fixed minimums or the minimum between two maximums if the correction level is marked by the price peak.
Subtract the value of the last low from the critical price. In the reverse procedure, the critical price is subtracted from the last High.
In this way you can determine the resumption points of the trend. If calculated correctly, the figures obtained will correspond to the key correction levels of 0.382 and 0.618.
However, all these mathematical actions are possible only within the framework of the emerging price corridor. If the value of an asset reaches record values, it is no longer possible to determine significant points using the method described. Under these conditions, Denmark multiplies the maximum price by 0.382 or 0.618.
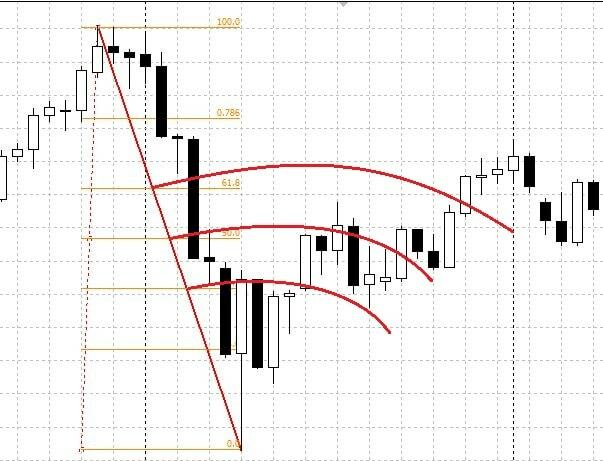
To take into account the time factor in the forecast, Demark offers an innovative solution and introduces the concept of “floating price target”. On the chart, the numeric values line up in the shape of an arc.
TD bows set the recoil radius and are built as follows:
- the ends are connected by a line, similar to the rule considered above;
- the straight line marks the levels of 0.382 and 0.618;
- arcs are drawn through them in the left-to-right direction, centered on the point of the last Low or High.
Application of trend factors
To predict price trends, Demark suggests using a series of numerical indicators, which he refers to as Trend Factors. The minimum value is 0.0556, the maximum is 0.9444.
A trader can establish the possible position of corrective levels by identifying the initial extremes and multiplying them by a series of numbers.
Critical reference points must correspond to a certain pattern of price dynamics. For example, like this:
- the closing price has fallen steadily over the two days until the original low was traced;
- the day after the true benchmark was set, the closing price rose.
When the price rises, the initial resistance level is determined by multiplying the low by 1.0556, the second level by multiplying it by twice 0.0556 (1.112), the third by 1.14.
If a trader wants to position support levels when the price falls, he works with a true high. In this case, the following coefficients will be used for the calculations:
- 0.9444 – for the first level;
- doubled 0.9444 (0.8919) – for the second;
- (0.8919×0.9722) – for the third.
This method of determining correction levels provides a reliable image when working with long time frames and is not suitable for intervals of hours and minutes.
So, we have considered the key provisions of Thomas Demark’s theory, which allow a more precise and formalized technical analysis. When implementing the principles proposed by the author, a trader should conduct a thorough analysis of the results, since the modern market has become more dynamic.